Monday, April 20, 2020

Measure Ground Control

Assignment Introduction:

Measure Ground Control is a UAS software that incorporates operations, maps, data, reporting, and camera settings on one application. This helps UAS operators during operations by lowering the amount of time that the pilots need to check operating parameters. Measure also has cloud storage so that flight plans can be accessed from multiple devices. This helps with efficiency because if a flight plan is already flown, new plans won't need to be created. This single source of truth that measure provides ensures that everyone is using the same information when flying missions.

Assignment Methods:

One of the main features of Measure is the integrated maps that shows any flight restrictions within the area. Figure 1 shows an area with the restrictions shown on the map.


Figure 1. Rules and Advisories in the Measure App

Measure also adds easy access to LAANC (Low Altitude Authorization and Notification Capability) which authorizes flights within permitted areas. You must have the AirMap app on the device where you request. This is important to UAS because some commercial operations might need to be flown in airspace where a regular flight isn't permitted. This makes the whole mission planning process much easier.

Measure integrates sensor settings into one app, this helps with mission execution because pilots can access flight parameters in one app. Checklists are an important part of flight safety, Measure can help this process by having all the checklist objects in one app. The settings tab is shown in Figure 2. 

Figure 2. Settings Tab of Measure App
The flight screen on Measure is mainly used for autonomous flight. It has all the information you need for flight monitoring on one screen, this will eliminate the need for the pilots to take their eyes of the flight parameters or switch applications. Figure 3 shows the flight tab.

Figure 3. Flight Plan Tab of Measure

Measure also has a section to create easy flight plans. These flight plans can be reused at a later date, so different pilots can fly the same plan. A certain person can assign pilots to different flight plans, this helps to manage a team of pilots all on the same project. Figure 4 shows a flight plan over a field.

Figure 4. Flight Plan on Measure
The settings on the left-hand side will change the flight path, one of these settings is altitude. Changing this will make sure that you can fly above all the obstacles on the flight plan. Figure 5 shows how the setting affect the mission.

Figure 5. Flight Plan on Measure with Settings Changed. 

Assignment Conclusions:
UAS operations rely heavily on mission planning. The level of detail that goes into mission planning usually dictates how the operation will go. Measure Ground Control app helps mission planning in multiple ways by incorporating maps, sensor data, flight plans. The in-flight tab also allows pilots to see all flight parameters on one screen. The SSot that measure provides is important because it allows for multiple pilots to draw information from the same source with greatly improves safety and efficiency.


Monday, April 13, 2020

Using Arc Collector

Assignment Introduction:

Arc Collector is a GIS tool that is used to collect data in the field. It allows multiple people to contribute to the data collection process. This data can be integrated into any other ArcGIS maps. Some of the uses of this app include ground control points. This can allow for better processing as it relates to UAS data because you know the GPS location on the ground. Figure 1 shows GCPs on the ground.

Figure 1. GCPs Collected on the Ground


Assignment Methods:

For this assignment, I followed this tutorial: https://www.esri.com/arcgis-blog/products/collector/field-mobility/make-your-first-collector-map/

The first step is to prepare the layer, this has to be done on ArcGIS Online before moving it to the Collector app.  Figure 2 shows how to create these fields in ArcGIS. Three different layers were created: paths, places, and areas. After creating the layers, assets are created to represent the types of amenities in the park. These are created and the symbology is changed to represent the object. Figure 3 shows these amenities and their symbols.

Figure 2. Type of Amenity Field


Figure 3. Types of Amenities 

After your objects are created, you can go into Collector and places the objects in the field. Figures 4 and 5 show how this is done.

Figure 4. Adding Dirt Paths in Arc Collector
Figure 5. Adding Picnic Tables in Arc Collector

Assignment Discussion:

Another use of Arc Collector is collecting Ground Control Points, this helps when trying to get more accurate processing as discussed in previous posts. These GCPs could be collected with a phone but should be collected via GPS survey. The following map shows GCPs that I have collected.


This map is only a small glimpse into what can be done with Arc Collector, another way to use it is assessing damage after storms, fallen trees or downed power lines can be marked on the map to come up with different routes.

This map layout is shown in Figure 6.

Figure 6. GCPs of a Proposed Construction Project


Sunday, April 5, 2020

Value Added Data Analysis

Assignment Methods:

The first step was extracting the spectral bands, this function on ArcGIS changes the band combination to see the urban features. This band change can be seen in Figure 1.
Figure 1. Band change of Area


Once this is done, you have to better segment the image. To do this, classes were created for the different terrain in the image: Gray Roofs, Roads, Driveways, Bare Earth, Grass, Water, and Shadow. The classified image can be seen in Figure 2.
Figure 2. Different Terrain Types


The next step performed was to merge the classes into two master categories: pervious, and impervious. These two categories represent land cover. After this, errors were found and the image was reclassified to help with the images. This newer image with the classes merged can be seen in Figure 3.
Figure 3. Pervious vs. Impervious Terrain


The final maps, as shown in Figures 4 and 5 below, show the pervious and impervious terrains of an area. The second map shows this area further separated into specific terrains.
Figure 4. Pervious vs. Impervious Terrain

Figure 5. Classification of Terrain

Assignment Conclusions:

The maps shown above are an example of how versatile UAS data is, this particular data set can be used to calculate how much of a certain area is being taken up by houses or roads. This type of spectral analysis could also be used for other industries as well, such as forestry.


Wednesday, March 4, 2020

Volumetrics with UAS Data

Assignment Introduction:

Volumetrics is a tool used to calculate the volume of a designated area. It is typically used when trying to calculate stockpiles of materials. Do do this type of analysis, you need a few things, the first being a DSM of the area that you're trying to analyze. This DSM may require you to filter out some things that are going to mess with your output value. UAS platforms are very good at collecting volumetric data. Figure 1 Shows an example of a stockpile that could be analyzed.
Figure 1. Example of a stockpile

Assignment Methods:

Pix4D
The methods section of this post will show how to do volumetrics using ArcGIS Pro and Pix4D. Pix4D will be covered first. You must first have already completed a DSM of the area prior to doing volumetrics. Figure 2 shows the volume function on Pix4D, this will allow you to create a boundary around the analysis area, figure 3 shows an example of the total selected area.
Figure 2. Volume Tool Icon in Pix4D

Figure 3. Total Selected Area

After the area is selected, Pix4D will calculate the volume above the plane. The elevation plane can be changed inside Pix4D. The output value will look similar to figure 4. 

Figure 4. Volume Output in Pix4D

ArcGIS Pro

The other way to compute volumetrics is using ArcGIS Pro. This method may take more time but is easier to put into a digestible format for viewers. Similar to Pix4D, you must have a DSM of the area on your map. The first step is to create a clip of the area you want to analyse. Figure 5 shows an example of a clip inside ArcGIS Pro. You need to make sure that the clip has the same coordinate system as your DSM. 

Figure 5. Clip of the Selected Area

The clip is currently just an ordinary polygon, you need to extract whats inside the boundary before continuing. ArcPro GIS has a tool do do this, "Extract by Mask". This tool will allow you to only select whats inside the clip. After performing this feature, you can now calculate your volume. Use the tool "Surface Volume" to do this, again, similar to Pix4D, you can adjust your elevation plane. For sake of comparison, both elevation values used were 292.85 m. After computing the volume, ArcPro should output a text file with all of your values, this should look similar to figure 6. Figure 15 shows a full analysis of wold creek.

Figure 6. Text File Output
Figure 15. Volumetric Analysis of Wolf Creek

Assignment Discussion:

The following table are the results from the volumetrics analysis that was completed in this lab. Figure 7 shows the comparison of methods between Pix4D and ArcGIS using the Wolfcreek Data set. Both methods seem to get roughly the same outcome but Pix4D does take a longer time to process the data.

Figure 7. Comparison of Volumetric Analysis Processes


The next data set that will be discussed is the Litchfield Dredging Operation. The volumetric analysis of this data was completed using ArcGIS. The data set in question is split into 3 different dates with different sampling distances and DSM heights. Figure 8 compares the different dates.

Figure 8. Comparison of Layers


For the data to be more accurate, the DSMs needed to be re-sampled so they had similar properties. There are many re-sampling methods that have advantages and disadvantages but here are some of them:

  • Nearest Neighbor - Uses nearest pixel to calculate the output 
  • Majority - Uses majority pixel value in the nearest 16 pixels to calculate output
  • Bilinear - Uses the distance-weighted value of the four nearest pixels to calculate output
  • Cubic - Uses a pixel based on a smooth curve through the 16 nearest pixel to calculate output
The default resampling method is not the best option in terms of the resolution but it might take less time to process. 


After being re-sampled, the next step was to create the clips of the pile areas for each date. This clip creation use the same process as covered in the methods section of this post. Figures 9, 10, 11 show the different areas used for the volume analysis.

Figure 9. Area of Pile on 07/22/18
Figure 10. Area of Pile on 08/27/18
Figure 11. Area of Pile 09/30/18

After the clips were created, the "extract by mask" function was used on all 3 clips as was done in the methods section. The results were then compiled and put into a table. Figure 12 shows the results of the volumetric analysis. Figure 13 shows these results in a single map.

Figure 12. Results of the Volumetric Analysis
Figure 13. Volumetric Analysis of Litchfield Dredging Operation over Time

Another function was also used in this data set, a cut-fill. This process is very qualitative as it shows the gain or loss of a pile. Similar to the volumetric analysis, the common base level needs to be established so that can be the neutral level. The cut-fill operation contains a lot of noise, such as trees or other foliage, so the map must be taken with a grain of salt. Figure 14 shows a map of the cut-fill operation.

Figure 14. Cut-Fill of Litchfield Dredging Operation

Assignment Discussion:

Volumetrics can be a useful tool in UAS as mission can be flown a lot easier than planes or larger rotorcraft. This type of analysis can also be applied to other situations such as trying to calculate the volume of a retention pond to make sure that it can fit all the water. 


Wednesday, February 26, 2020

Using GCPs to process data in Pix4D

Assignment Introduction:

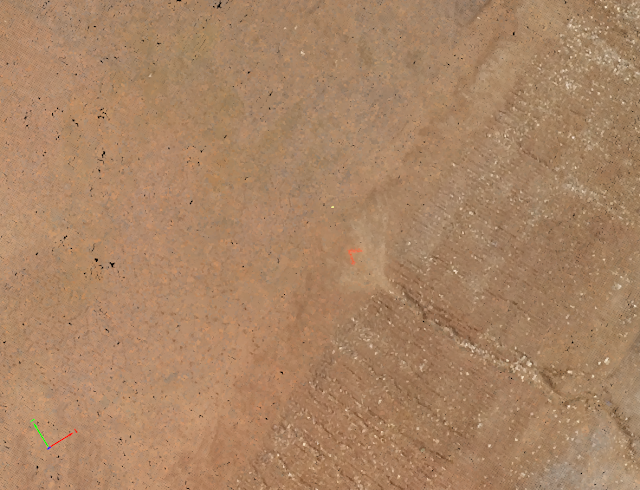
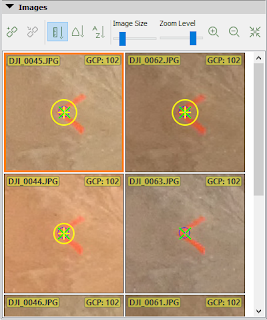
This assignment is an overview of processing Pix4D data with Ground Control Points (GCPs). GCPs are a marked point on the ground where you know its true location. This point can then be identified in the image in Pix4D to make sure that your data is accurate. GCPs are not to be confused with check points. Check points only show error but do not correct the data like GCPs do. Figure 1 shows a GCP in the imagery.

Figure 1. Ground Control Point Marking

Assignment Methods:

The first step when processing Pix4D Data is to have correct file structure. This should be done by creating separate folders inside your project folder: Collection, Processing, Analysis. Metadata should also be included in the project folder. Figure 2 shows a proper file convention. 

Figure 2. Correct File Convention

Inside the collection folder should be the imagery and your GCP data. Once you import your imagery data into Pix4D, you should complete the initial processing. This should generate a quality report so you can get an idea of how well your data will process. Figure 3 shows an example of how a quality report should look. 

Figure 3. Quality Report

Once this is done, you will need to use the Raycloud Editor, this will allow you to correct the images to your GCPs. Figure 4 shows what the Raycloud Editor should look like.

Figure 4. Raycloud Editor 
Once your GCPs are corrected you can continue with the DSM and orthomosaic processing. Figure 5 will show the final product after correcting the GCPs

Figure 5. Final Product with GCPs

Assignment Conclusions:


This assignment used GCP corrections, this differs from the previous post where the imagery was processed without GCPs. You can see where the map that used GCPs are a lot more accurate than the map that did not. This is because the corrections were not used to ensure that that data is correct. Figure 6 is the map that was processed with GCPs. Figure 7 shows the map that was processed. Figures 8 and 9 compare the two elevation values, note that the GCP value is a lot more accurate.

Figure 6. Processed Image with GCPs
Figure 7. Processed Image without GCPs
Figure 8. Elevation without GCPs
Figure 9. Elevation with GCPs