Assignment Introduction:
Volumetrics is a tool used to calculate the volume of a designated area. It is typically used when trying to calculate stockpiles of materials. Do do this type of analysis, you need a few things, the first being a DSM of the area that you're trying to analyze. This DSM may require you to filter out some things that are going to mess with your output value. UAS platforms are very good at collecting volumetric data. Figure 1 Shows an example of a stockpile that could be analyzed.
 |
| Figure 1. Example of a stockpile |
Assignment Methods:
Pix4D
The methods section of this post will show how to do volumetrics using ArcGIS Pro and Pix4D. Pix4D will be covered first. You must first have already completed a DSM of the area prior to doing volumetrics. Figure 2 shows the volume function on Pix4D, this will allow you to create a boundary around the analysis area, figure 3 shows an example of the total selected area.
 |
| Figure 2. Volume Tool Icon in Pix4D |
 |
| Figure 3. Total Selected Area |
After the area is selected, Pix4D will calculate the volume above the plane. The elevation plane can be changed inside Pix4D. The output value will look similar to figure 4.
 |
| Figure 4. Volume Output in Pix4D |
ArcGIS Pro
The other way to compute volumetrics is using ArcGIS Pro. This method may take more time but is easier to put into a digestible format for viewers. Similar to Pix4D, you must have a DSM of the area on your map. The first step is to create a clip of the area you want to analyse. Figure 5 shows an example of a clip inside ArcGIS Pro. You need to make sure that the clip has the same coordinate system as your DSM.
 |
| Figure 5. Clip of the Selected Area |
The clip is currently just an ordinary polygon, you need to extract whats inside the boundary before continuing. ArcPro GIS has a tool do do this, "Extract by Mask". This tool will allow you to only select whats inside the clip. After performing this feature, you can now calculate your volume. Use the tool "Surface Volume" to do this, again, similar to Pix4D, you can adjust your elevation plane. For sake of comparison, both elevation values used were 292.85 m. After computing the volume, ArcPro should output a text file with all of your values, this should look similar to figure 6. Figure 15 shows a full analysis of wold creek.
 |
| Figure 6. Text File Output |
 |
| Figure 15. Volumetric Analysis of Wolf Creek |
Assignment Discussion:
The following table are the results from the volumetrics analysis that was completed in this lab. Figure 7 shows the comparison of methods between Pix4D and ArcGIS using the Wolfcreek Data set. Both methods seem to get roughly the same outcome but Pix4D does take a longer time to process the data.
 |
| Figure 7. Comparison of Volumetric Analysis Processes |
The next data set that will be discussed is the Litchfield Dredging Operation. The volumetric analysis of this data was completed using ArcGIS. The data set in question is split into 3 different dates with different sampling distances and DSM heights. Figure 8 compares the different dates.
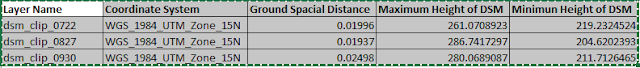 |
| Figure 8. Comparison of Layers |
For the data to be more accurate, the DSMs needed to be re-sampled so they had similar properties. There are many re-sampling methods that have advantages and disadvantages but here are some of them:
- Nearest Neighbor - Uses nearest pixel to calculate the output
- Majority - Uses majority pixel value in the nearest 16 pixels to calculate output
- Bilinear - Uses the distance-weighted value of the four nearest pixels to calculate output
- Cubic - Uses a pixel based on a smooth curve through the 16 nearest pixel to calculate output
The default resampling method is not the best option in terms of the resolution but it might take less time to process.
After being re-sampled, the next step was to create the clips of the pile areas for each date. This clip creation use the same process as covered in the methods section of this post. Figures 9, 10, 11 show the different areas used for the volume analysis.
 |
| Figure 9. Area of Pile on 07/22/18 |
 |
| Figure 10. Area of Pile on 08/27/18 |
 |
| Figure 11. Area of Pile 09/30/18 |
After the clips were created, the "extract by mask" function was used on all 3 clips as was done in the methods section. The results were then compiled and put into a table. Figure 12 shows the results of the volumetric analysis. Figure 13 shows these results in a single map.
 |
| Figure 12. Results of the Volumetric Analysis |
 |
| Figure 13. Volumetric Analysis of Litchfield Dredging Operation over Time |
Another function was also used in this data set, a cut-fill. This process is very qualitative as it shows the gain or loss of a pile. Similar to the volumetric analysis, the common base level needs to be established so that can be the neutral level. The cut-fill operation contains a lot of noise, such as trees or other foliage, so the map must be taken with a grain of salt. Figure 14 shows a map of the cut-fill operation.
 |
| Figure 14. Cut-Fill of Litchfield Dredging Operation |
Assignment Discussion:
Volumetrics can be a useful tool in UAS as mission can be flown a lot easier than planes or larger rotorcraft. This type of analysis can also be applied to other situations such as trying to calculate the volume of a retention pond to make sure that it can fit all the water.


